Methods
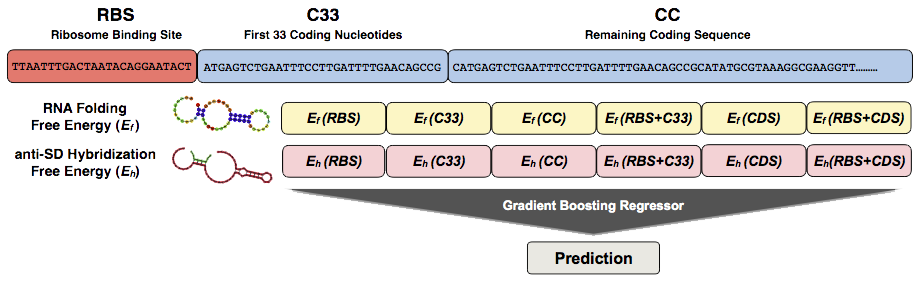
PGExpress is a regression method that predicts the gene log2-fold-change of the translation efficiency (L2TE) with respect its median value observed (2,355)from sequence information. PGExpress is based on gradient-boosting-regressor algorithm that takes in input a 12-elements vector encoding for
-
6-elements vector for the predicted RNA folding free energies
-
6-elements vector for the predicted anti Shine-Dalgarno (SD) hybridization free energies
In detail, each construct is divided in three blocks: the Ribosome Binding Sites (RBSs),
which consists on average ~25 nucleotides preceding the coding sequence, the first 33 nucleotides of
the coding region (C33) and the remaining part coding sequence starting from nucleotide 34 (CC).
Thus, each sequence is represented by the 6 fragments including the 3 blocks previously defined
(RBS, C33 and CC),
and the combinations of RBS with C33 (RBS+C33), C33 with CC (CDS) and RBS with the whole coding sequence
(RBS+CDS).
For each block we calculated the RNA folding and the anti-Shine-Dalgarno (anti-SD) hybridization free energies
using respectively RNAfold and RNAduplex tools from the ViennaRNA package
(Lorenz, et al., 2011),
which automatically replace Thymine (T) with Uracil (U). We used a 8-nucleotides anti Shine-Dalgarno
sequence (CCTCCTTA) as reported by Kosuri and coworkers
(Goodman, et al., 2013). Both pseudo-energies
have been rescaled a using a temperature of 30 ℃. The PGExpress uses the GradientBoostingRegressor
function implemented in the scikit-learn package and it returns in output the predicted L2TE value.
A representation of our methods and its 12 input features is reported in the figure
below.
PGExpress has been trained on a set of using a dataset composed by 1,722 combinations of RBS and Coding sequences
from 137 genes for which the experimental measures of the translation efficiency was reported
(Goodman, et al., 2013).
We performed a gene-based 10-fold cross-validation approach on the WT-High dataset to keep all the constructs
belonging to the same gene in the same subset.
To test the performace of PGExpress we performed a regression analysis and calculated the
correlatation coefficient (r) between the predicted and the experimental L2TE values, the
root-mean-sauqre-error (RMSE) and the mean absolute error (MAE).
The performace of PGExpress has been also evaluated as binary classifier considering as positive
the cases with L2TE>0 and negative those with L2TE≤0.
Thus, we scored the performace of PGExpress as binary classifier calculating the Accuracy (ACC)
the Matthews Correlation coefficient (MC), and Area Under the Receiver Operating Characteristic Curve (AUC).
The performances reported below represent the average values obtained over five 10-fold cross-validation
tests.
| Dataset | r | RMSE | MAE | ACC | MC | AUC |
| WT-High | 0.57 | 1.38 | 1.08 | 0.73 | 0.47 | 0.80 |
All the dataset used for training and testing PGExpress is available at this link. The sequence of the superfold GFP (sfGFP) domain used as C-terminal part of the coding sequence (CC) is available at this link.